Line throughput increase: Bottlenecks

Every process has a bottleneck which is the slowest.

The key to improving performance is to find the bottleneck and to increase its output.

This article focusses on line throughput increase within manufacturing facilities; for an example in document processing click here.

Useful Templates

Below are two spreadsheets, one is a blank Pareto analysis sheet with an action tracker and the other is a worked example so you know how to use the blank.

Theoretical vs. Actual bottleneck

The theoretical bottleneck is the process which has the slowest design capacity which may or may not be the same as the actual bottleneck.

The actual bottleneck can be different from the theoretical one depending on the how the other parts of the production line perform. Some of the performance elements to look out for are:

  • Defect rate: defects will need to be re-worked or scrapped which is a limit on number of good pieces produced
  • Down time: This can be from breakdowns, change overs, proactive maintenance requirements
  • Material availability to be processed
  • Buffer space to absorb minor stops elsewhere to allow the bottleneck process to keep running

Once you have found the bottleneck process, the aim is to have it running as much as possible; if you lose 1 minute at the bottleneck, you can never recover that time.

We will follow through an actual example of increasing capacity of a production line using simple, low cost solutions.

The only reason you can get to simple, low cost solutions is to dig right down in to the detail so you fully understand the system better than anyone else.

Example production line:

Let’s say that your production line has 5 steps as shown below:

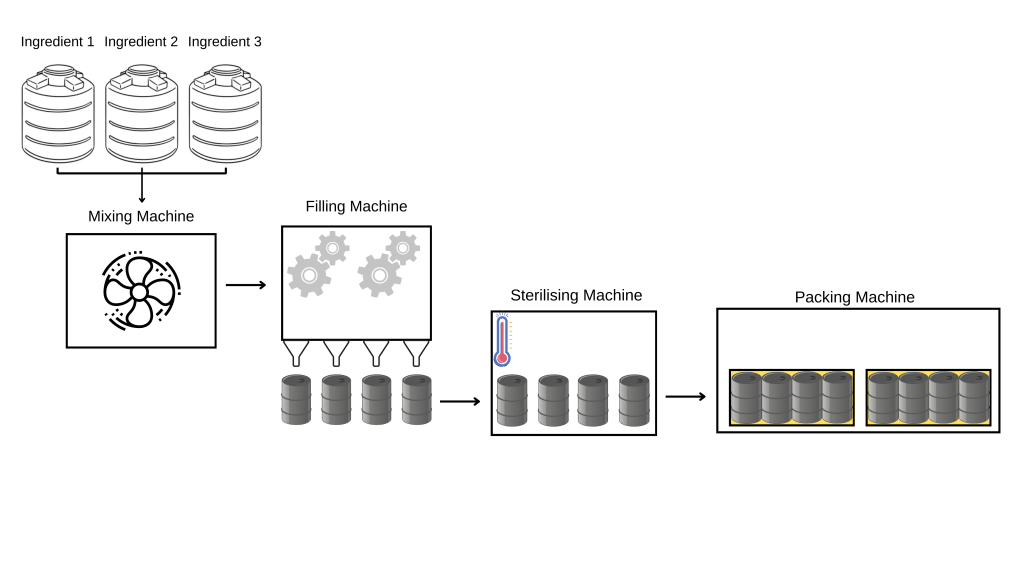
The 5 elements of the production line (and their theoretical throughput) are:

  • Ingredient delivery – 1,000 Kg /Hr
  • Mixing – 800 Kg/Hr
  • Filling – 700 Kg /Hr
  • Serilising – 850 Kg/Hr
  • Packing – 1,100 Kg/Hr

Building the (theoretical) bowtie

The bowtie is a simple way to represent capacity of a production line (or series of processes).

Each section of the bowtie represents a process step and has both a theoretical and an actual capacity.

Put in to the bowtie format, the line now looks like this:

It is now easy to see which process is the theoretical bottleneck based on design capacity. Theoretical capacity is the processing speed of that part of the line had infinite product to process, infinite space to put the processed parts and never broke down.

Now then, what is the theoretical maximum output of the production line?

700 Kg/Hr.

This means that every other process, upstream and downstream of the bottleneck won’t run for a whole hour. Let’s add average hourly run time for each process to the bowtie:

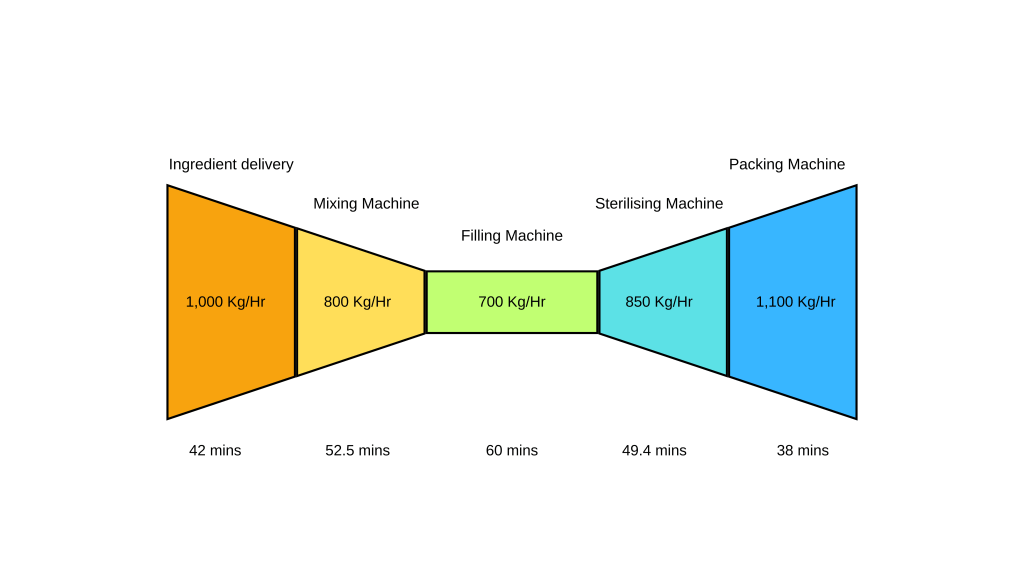
The above now shows the hourly uptime required for each process to match the throughput of the bottleneck. Thus, if you lose 1 minute at the ingredient delivery machine, it will be able to make up for that lost time as it has spare capacity.

The Filling machine however has no spare capacity and 1 minute lost at this process can never be recovered.

Building the (actual) bowtie:

Now let’s add another layer of complexity to this production line.

Let’s say that you take a look at the actual throughput of your production line and realise that your throughput is actually closer to 450 Kg/Hr; far below the theoretical 700 Kg/Hr that your line was built to deliver.

To figure out where the problem is, you can start at your bottleneck process and gather some more data. This can be done quickly by standing at the process with a stopwatch and record the down time and why it stops.

Uncovering main down time reasons:

Step 1:

Print out a copy of page 1 of the Pareto blank template (above) and take that to the line with you.

Step 2:

Fill in the sheet with down time data and add your own D/T reason codes (you get these from observing why the process stops).

If the filling machine stops because product has nowhere to go, then the problem is downstream and if it stops because it has no product, then the problem is upstream.

The longer you spend watching the process and gathering data in this way, the more you will observe and the more accurate data you will gather about the machine stops.

Step 3:

Enter the data you have recorded in to the Pareto blank document on your computer.

Go to the second tab, right click anywhere in the table and then hit “Refresh”.

Step 4:

Note the top reasons for the down time.

In the example sheet, the top 3 reasons for down time are:

  • No product (NP) – 45 mins
  • Change over (CO) – 30 mins
  • No buffer space (NBS) – 15 mins

If the main reasons for stoppages are upstream or downstream, then repeat steps 1 – 4 on the processes either side of the theoretical bottleneck to do a deep dive in to those processes to understand what is restricting the throughput.

Step 5:

Once you are sure you have uncovered the top reasons for the bottleneck stoppages, fill in the action tracker with specific steps you will take to eliminate or reduce this down time.

The new bowtie:

So you now realise that a big part of the down time is coming from one (or several) of the previous processes. You repeat the steps 1-4 above and your data suggests that the whole time spent waiting for product is from the mixing step.

The new line bowtie now looks more like this:

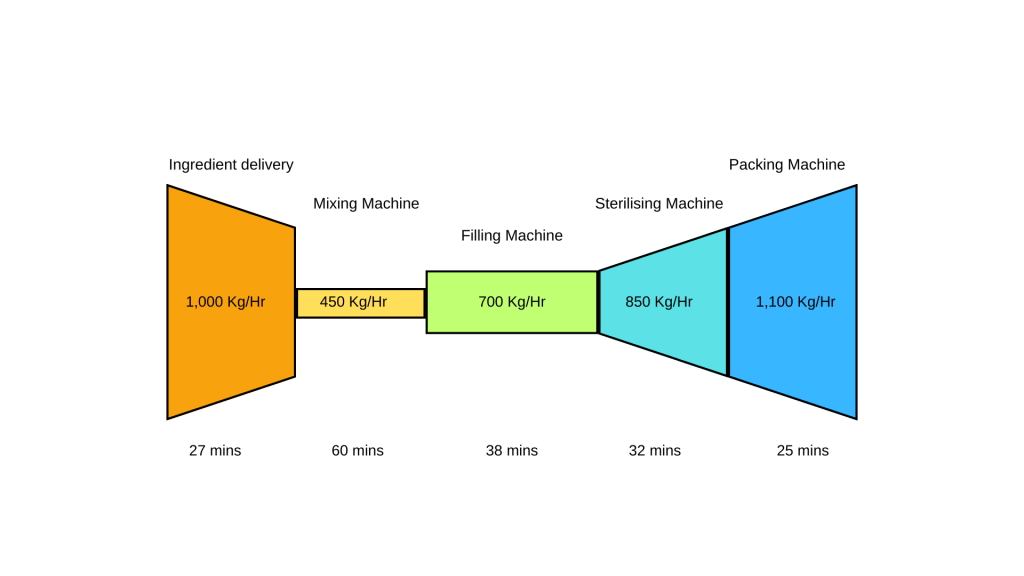
As you can see the bottleneck is now the mixing machine and all of the other processes now have to run even less time each hour to keep up with it.

The Devil is in the detail:

Now the best bit starts!

From your analysis of going through the steps 1-4 above on this process, you note that on average, the process is stopped for the following periods each hour:

  • Hot water delivery – 15 mins / Hr
  • Mixing time – 10 mins / Hr

Hot water delivery:

Drilling down further as to why you are waiting for hot water, it becomes clear that the hot water feed is shared with another production line that takes priority AND the heating method is slow (heating jacket surrounding a pipe).

The solution?

  1. Give that process it’s own hot water feed that is independent of any other line or process
  2. Change the heating method from a hot water jacket to direct steam injection using a hydrothermal valve

Mixing time:

The mixing time is fixed by the R&D department and would require new equipment and potentially a larger tank to do this (both of which are very costly).

After some research, it turns out that the pump that delivers the mixed ingredients to the next process doubles as a high sheer mixer.

The solution to reduce mixing time?

Add a valve to the existing pipework to put in a recirculation pipe back in to the tank. As the regular mixer does its work, the pump will mix the product and put it back in to the tank. Not only does this reduce your mixing time but it also allows you to increase the capacity of that process to compensate for the product recirculating in the pipework.

Now repeat:

Once this is done, you can go back through the process of timing each process to determine which is your new actual bottleneck.

It’s possible that it matches up with the theoretical one but in any case, you now have the framework to go through the new bottleneck to free up further capacity.

Spend more time at the Gemba!

Gemba: Japanese word meaning “the actual place”. For a business, the Gemba is where the work happens to drive the economic engine of the organisation. For a factory, it’s the shop floor and for a sales team it’s on the sales call or the office of those who buy from you.

Seniority vs. improvement

The position you hold in you organisation should determine how much of your time you spend focussing on maintaining or improving standards.

This graphic broadly represents where you should put your focus for each stage of seniority within a company hierarchy.

Take a look at where you are, and think about how much you adhere to this model.

Figure 1: Seniority vs. improvement focus (Graphic taken from Gemba Kaizen by Masaaki Imai)

I believe that the above graphic should be used with this one in mind. Managers at each level need to spend time at each Gemba at the lower levels.

Figure 2: Seniority vs. support

There are a lot more front line employees than there are managers and each level of management should support and guide all levels below them. Ultimately, the culture of the organisation is built through a lot of factors including (but not limited to):

  • The minimum acceptable standard at each level of leadership
  • The self-discipline of employees
  • The standards that are set and how well they are adhered to
  • Attitude of managers at every level

As a leader you are responsible for setting an example for those who work within your area of responsibility. The more senior the manager, the more people fall within their area of responsibility and thus the more accountable they should be for the standards set within their area.

Iceberg of ignorance:

The iceberg or ignorance illustrates the problem that most organisations face when trying to drive improvements.

Figure 3: Iceberg of ignorance – sourced form https://kathleenallen.net/insights/the-iceberg-of-ignorance/

Only a tiny percentage of problems faced by organisations are known to senior level managers because of the over reliance on hard data filtered upwards from performance tracking.

In order for organisations to get the best results and work as per figures 1 & 2, more time needs to be spent at the gemba.

Front line employees:

Maintaining standards for front line employees is critical as they tend to be the ones who have the most contact with the product or the customer and thus have a huge impact on the quality and consistency of the product or service you provide.

The next thing to consider are the safety implications of not maintaining standards. Many front line employees in construction, agriculture or manufacturing, use or are exposed to machinery or work environments which, if not treat correctly, can lead to serious injury or death.

The aim of the front line employees should be to spend 95% to 99% of their working time maintaining current standards. The remainder of their time should be spent working with all of the support functions and managers to highlight areas where improvements in standards are required.

At the level of the front line employees there needs to be focus on addressing all of the small inefficiencies at the gemba that together build up to cause serious performance impact on the whole organisation.

Low level management:

The low level management team are responsible for ensuring the correct standards are in place and that they are followed by the front line employees. This is arguably one of the hardest areas of management unless your organisation truly understands and applies the concepts in Figures 1 & 2.

The Low level managers should open up communication pathways with their teams, outside of the daily performance meetings to highlight minor inefficiencies to them. Once these managers are aware of these issues, they can empower their them (and give them the time) to make improvements themselves on a smaller scale before rolling out the new standard to the rest of the front line workers or garner support from other functions to improve the standards.

My recommendation here would be for the low level managers to purposefully spend time, walking around their gemba, speaking to members of their team to understand what they need further support or help with that will improve conditions and standards.

Middle level management:

The overall vision and purpose of the organisation should come from the top levels and this direction should help prioritise the work that is required at the lower levels. The best organisations not only put focus on the big projects that will help improve performance (Driven mainly from the top) but also on all of the small inefficiencies in the work of the front line employees.

This is where the middle level management come in.

Their focus should be supporting the lower level management and the front line employees to drive improvements based on information they gather from walk arounds, coaching sessions and the system of daily performance meetings common in most organisations.

In my experience, where most companies get it wrong is that they rely solely on the data they get from the daily performance meetings but nothing beats performing walk arounds and speaking to the front line employees to understand directly from them what they need further support with.

My recommendation would be for Low and Mid level managers to perform walk arounds and speak to front line employees at the gemba minimum 3 times a week (outside of the daily performance meetings). Then each manager can put focus on solving one problem for the front line employees, very quickly you will see a huge uplift in engagement and performance often with little to no spend.

Senior level management:

Senior managers set the direction, vision and purpose for the site / organisation. They tend to use top level information delivered through the various performance meetings of the company to make decisions.

Although making decisions in this way can be very efficient, it becomes more likely to miss a lot of the key information and context behind the numbers that will help make the right decision.

Once again nothing beats spending time at the Gemba.

I have seen senior level managers spend millions of dollars on huge projects to improve performance to only see a small shift in the bottom line.

The devil is in the detail as they say and sifting through pure data at a high level only gives you part of the picture. You can get the top level view of where you need to improve by looking at the top level numbers, but the people at the lowest levels are the ones who work to make poorly made decisions and poorly designed systems deliver an saleable output.

The best organisations use hard data from numerous and the data they gather in person at the gemba to make the best decisions on where to spend money AND time to improve performance.

Become the most curious person in the room

The Oxford English Dictionary defines curiosity as: “A strong desire to know or learn something”

If you develop curiosity in your day to day and your work life, your learning speed, ability to deal with ambiguity and your creativity will all increase.

You can develop your curiosity simply by questioning things that you are told, by asking “why?” because context matters. Understanding the context as to why things are done the way that they are is critical to gaining a fuller understanding of a process. You will discover that sometimes accepted norms made sense in times gone by, when the context was different but may not actually make sense in the current context.

Here are a few stories that truly illustrate why curiosity is so important.

How do you thaw your frozen turkey for thanksgiving?

It is November 22nd and Jenny is preparing her first thanksgiving dinner. All of her close friends and relatives will be arriving the following day to enjoy this yearly tradition together. As she wants everything to run smoothly on the 23rd, she makes sure to do as much prep as she can ahead of time. She takes the frozen turkey out of the fridge and puts it in the sink to let it finish thawing overnight. After carefully placing the large semi-frozen bird in the sink, she is careful to remember to put a dish rack over the top.

Her husband walks into the kitchen and sees the turkey in the sink and asks her what the dish rack is for.

She tells him that her mother had always done that when thawing the turkey in the sink.

The following morning, Jenny’s mother arrives early to help with the final dinner preparations for the day and asks her daughter how things are going.

Jenny says, “Fine mum; I have everything ready to go in the oven. I even remembered to put the rack over the turkey last night.” 

Her mother looks back at her, a confused look on her face. “What are you talking about?” she asked.

Jenny replied “You always made sure to put the dish rack over the turkey when it was thawing in the sink so I did the same

Her mother laughs and says “Yes but honey, we had cats!”

So you can see how norms and practices that once made sense within the original context in which they were made, but when removed from that context, make no sense at all. In today’s world, where progress and change are happening at ever increasing speeds, norms formed by the contexts of todays world will soon become irrelevant as well.

This is obviously a light hearted example where the cost of low curiosity has little impact, however there are times where low curiosity can cost people their lives or make someone a Billionaire!

I think you should start washing your hands:

Ignaz Philipp Semmelweis was born in Hungary on July 1st 1818. Semmelweis received his Medical Degree from Vienna in 1844 and became the maternity ward assistant at the local Hospital.

Although at the time many mothers delivered at home, one in 4 of those who had to come to the hospital to deliver due to complications, poverty of illegitimacy lost their lives to a condition known as childbed fever.

He found this mortality rate deeply unsettling as the hospital was the place where people were supposed to come to be healed by doctors trained in the latest medical practices of the time.

The experienced doctors and indeed the chief medical officer at the hospital seemed unperturbed by the high mortality rates of the new mothers because they believed that the disease was unpreventable.

Semmelweis, unsatisfied by what he was being told, took it upon himself to investigate the deaths even after receiving strong objections from the chief medical officer.

He observed a huge difference between the mortality rates of mothers delivered by the doctors versus those delivered by the midwives. He conjectured that the doctors must be doing something differently than the midwives during delivery but he observed broadly the same practices.

During his investigation, he scrutinised everything he could think of in an attempt to explain the difference but none yielded a definitive answer.

It wasn’t until the death of a fellow doctor, who died of what appeared to be childbed fever that he found what he was looking for. The doctor had cut himself on a scalpel he was using to dissect a woman who had died of childbed fever. This lead Semmelweis to realise that it was the doctors themselves who were infecting the patients as they would conduct autopsies in the mornings and then deliver babies in the afternoons, often without washing their hands or changing their clothes.

At the time bacteria were unknown but Semmelweis theorised that the doctors must be carrying invisible particles of decaying organic matter on their hands from the mornings autopsies. He immediately required that anyone coming to examine the women on his ward wash their hands with chlorinated lime before doing so.

This simple solution reduced the mortality rate to under 2% on his ward.

Unfortunately his solution was met with a lot of resistance because it implied that the doctors were themselves killing the patients.

This story highlights the importance of staying curious and using experiments and data to learn more about the current situation in order to derive theories about what might be a better way of doing things.

An experiment born of Curiosity sold for $1.2 Billion

In 1999, Nick Swinmurn was shopping at a San Francisco shopping centre looking for a pair of brown Airwalk Desert Chukka boots. One shop had the right style, but not the right colour, another had the right colour, but not the right size. After spending hours searching for the pair he wanted, Nick went home empty-handed and frustrated.

Nick’s frustration at not being able to easily and efficiently buy the shoes he wanted turned to curiosity as he wondered whether it would be possible to purchase the shoes online (it wasn’t). Realised that there may be an opportunity here to give customers like him what they wanted (to save time and energy finding shoes).

At the time, online shopping was in its infancy and people told him that no one would want to buy shoes on the internet. So Nick set out to test that theory.

He went in to local shoe shops and asked whether he could take photographs of the shoes they had, with the promise that if the shoe sold online, he would return at a later date and purchase the shoes at full price from that shop.

Many of the shop owners agreed and he proceeded to test whether people would indeed like to buy shoes online. Shoesite.com was born and in 2006 was acquired by Amazon.com for $1.2 Billion.

Now that is a huge return on curiosity!

Develop your own curiosity

So curiosity and the desire to not accept the norms of the time are critical to the improvement of any system or practice.

Sometimes you can get the answers that you seek by asking one or several people and sometimes you need to dig deep and perform simple experiments that test assumptions.

My rule of thumb is that before accepting something as being true or a constant, make sure you ask enough questions (and conduct enough tests where required) to learn enough about it so that you not only understand what is done, but also why it is done. Armed with this knowledge, you can then go on to make it better than it was before.

Task management – the DILO

You can’t manage time, you can actually only manage what you do during that time”

David Allen, Productivity Consultant.

If you have ever told someone else that you are bad at time management, or someone on your team has told that to you, then this page is for you!

In my experience, people who “don’t have time” may have one or several of these things happening:

  • The business priorities aren’t clear to them
  • They don’t know how to prioritise effectively
  • They spend time on low-value-added tasks at the expense of higher-value tasks
  • They don’t know how to say “no” to a request
  • They are inefficient in task completion

If you hear your team say this to you, then it is your job as the line manager to ensure that:

  • They know what the business priorities are
  • They understand how to classify tasks according to the urgent / important matrix
  • They know how to plan their time effectively
  • They don’t have tasks from other people on their to-do list

If you hear yourself say that to your line manager, then you may need help with the above as well.

The DILO (Day In the Life Of)

The DILO is a simple yet effective tool to map the tasks that are being conducted and what percentage of time is taken up by each task. I have described how to conduct the task for your direct report but if you realise that you need help to prioritise from your line manager then carry out the task for yourself and then meet with them to discuss.

The principle is simple:

Download the DILO template (see above) and fill in the top left boxes (time intervals / hr, Start time, Contracted hours) before sitting down with your direct report and asking them to fill it in over the next week.

Get them to add any recurring meetings or tasks to the DILO before they start.

Ask your direct report to set an alarm every 15 or 20 minutes (depending on your chosen time interval) of the day for an entire week. Each time the alarm goes off, they write down what they are currently doing.

At the end of the week, book in a meeting together and ask them to bring the DILO so you can go through it together and put each task in to the urgent / important matrix.

Go through the DILO and split the weekly tasks in to headings (meetings, personal development, lunch, break, own work etc) and put them in the week task summary table on the right hand side. Then count the number of each task type being performed and put it in the QTY column of that table.

This will now tell you what tasks are being conducted and what % of their contracted hours is taken up by each task type.

At the end of the meeting it should be clear to your direct report what tasks are the most important. It is also an opportunity for you to remove tasks from them, to understand where they might need more support, delegate less important tasks to others or push back tasks to other departments.

Real life example:

Below is the DILO for one of my direct reports that I asked her to do shortly after I joined the business. I wanted to get an idea of what tasks she was completing on a weekly basis.

I have highlighted all of the tasks in Red that I wanted her to stop doing, as they no longer fell under the remit of my team to carry out. Those tasks were given to her by the operations manager and were still required to be completed (just not by anyone on my team).

This is the summary of the table above by task and corresponding time taken over the week on that specific task.

As you can see, the time spent on the Factory IT System was 26% of her week and this task had nothing to do with my teams objectives.

So I took both tables to the Operations manager to show him just how much time this task was taking for my team member. This allowed the conversation to centre around the facts and gave him clear information that he needed to allocate that work (and thus that time) to someone else.

In the end, we agreed that my team would continue to carry out those tasks for the next 4 weeks while another person was trained and became competent in performing those tasks and my team member got about a quarter of her time back to focus on other work.